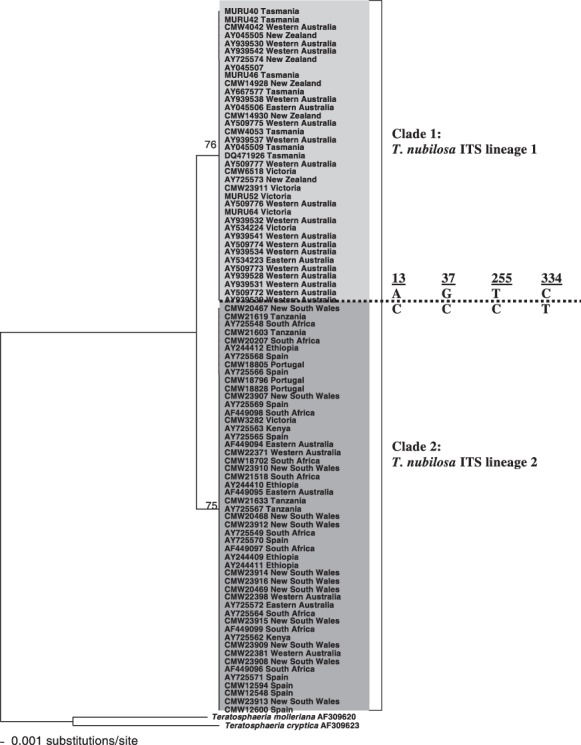
Figure 3.

Neighbour‐joining phylogram obtained from a distance analysis using the Hasegawa–Kishino–Yano (HKY) substitution model on internal transcribed spacer (ITS) sequence data of Teratosphaeria nubilosa isolates. Bootstrap values after 1000 replicates are shown above the branches. Teratosphaeria molleriana and T. cryptica were used as outgroups. Fixed sequence polymorphisms, separating clade 1 from clade 2, and their base‐pair positions are indicated at the broken line.
