
Figure 5.
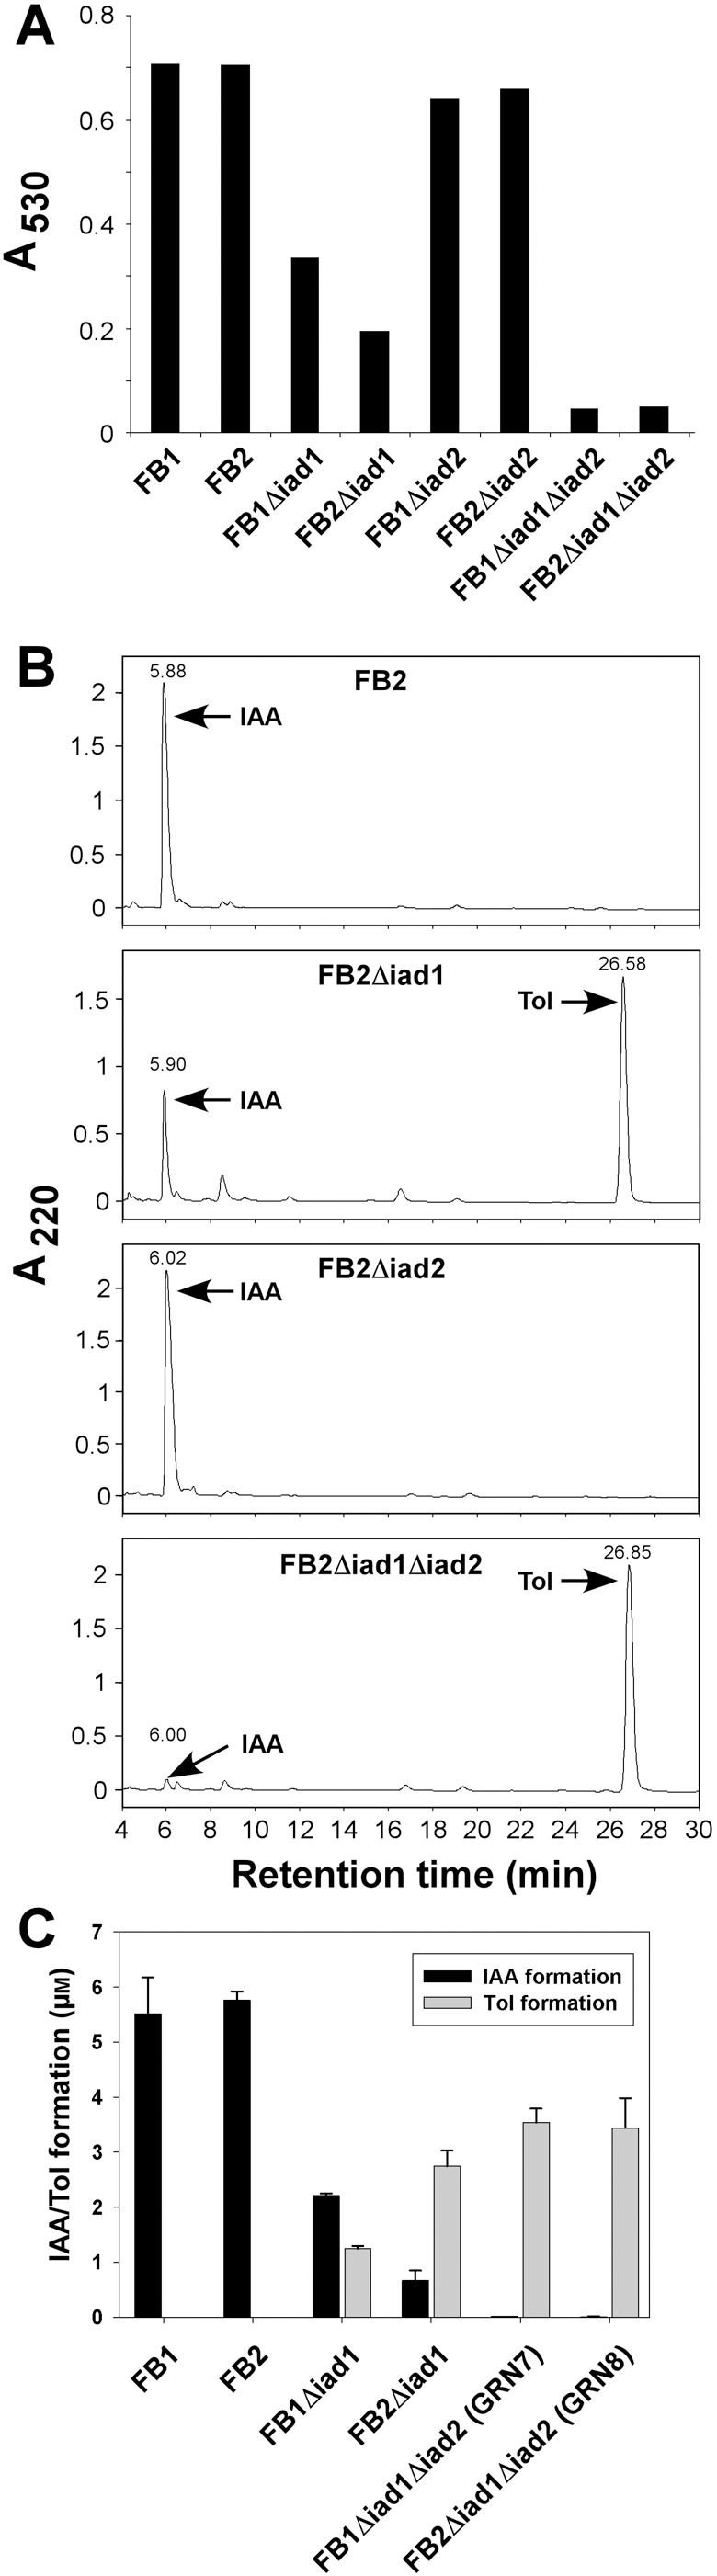
IAA and Tol production in Δ iad1/Δ iad2 mutant strains. (A) Strains FB1, FB2, FB1Δiad1, FB2Δiad1, FB1Δiad2 (GRN1), FB2Δiad2 (GRN3), FB1Δiad1Δiad2 (GRN7) and FB2Δiad1Δiad2 (GRN8) were incubated in the presence of 0.2 mm IAAld, and IAA formation was determined in culture supernatants (150 µL) by the Salkowski reagent. Absorbance was measured at 530 nm. (B) HPLC analysis of extracted culture supernatants from strains FB2, FB2Δiad1, GRN3 and GRN8 cultivated as described in A. Absorbance was monitored at 220 nm. Arrows denote peaks eluting like IAA and Tol, respectively. (C) Quantification of IAA and Tol formation. Extracted culture supernatants from strains FB1, FB2, FB1Δiad1, FB2Δiad1, GRN7 and GRN8 incubated in CM/Ara in the presence of 20 µm IAAld were subjected to HPLC analysis and peak areas were quantified for calculation of IAA and Tol concentrations. The mean (± SD) values were calculated from three replicates of a single strain.