
Figure 2.
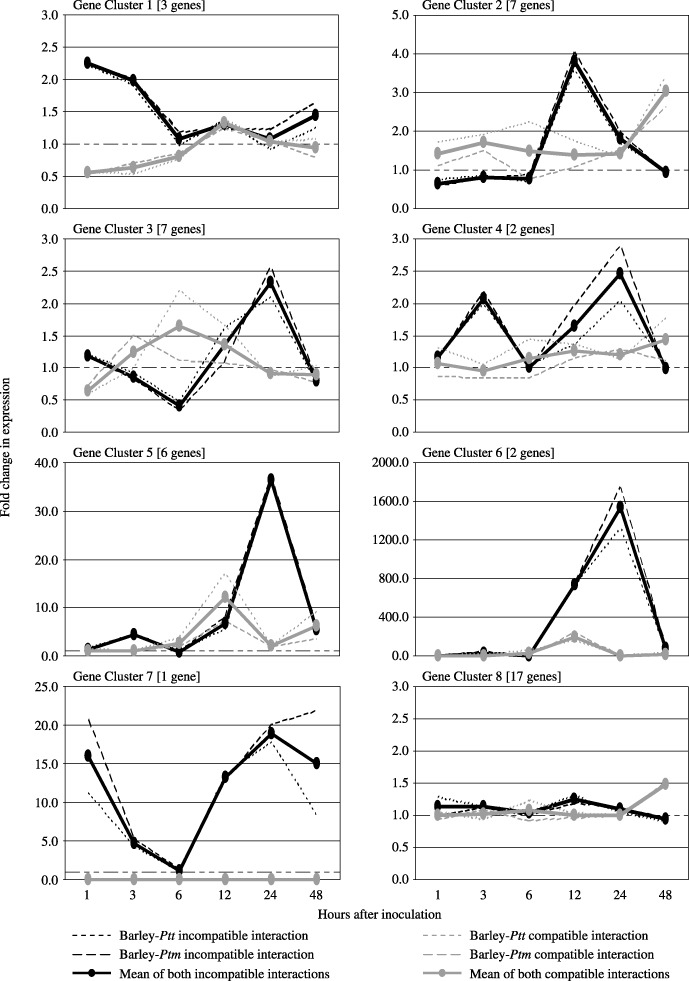
Grouping of 45 candidate DR genes into gene expression clusters based on their temporal expression profiles in the barley epidermis following infection with Ptm and Ptt. Broken lines represent mean expression profiles for genes in both barley–Ptm and barley–Ptt incompatible and compatible interactions. Solid lines represent consensus expression profiles generated from the means of both sets of incompatible and compatible interactions combined. The y‐axis indicates the fold change in expression for all genes in a given cluster relative to mock‐inoculated control plants.