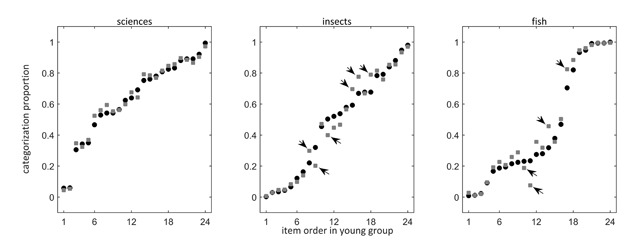
Figure 1.

Categorization proportions for SCIENCES (left), INSECTS (middle), and FISH (right) of the young (black circles) and the older adults (gray squares) in the Female Education Equated group. Items are ordered along the horizontal axis according to their categorization rank in the young group. Arrows indicate items that function differently in the young and older adults.
