Figure 1.

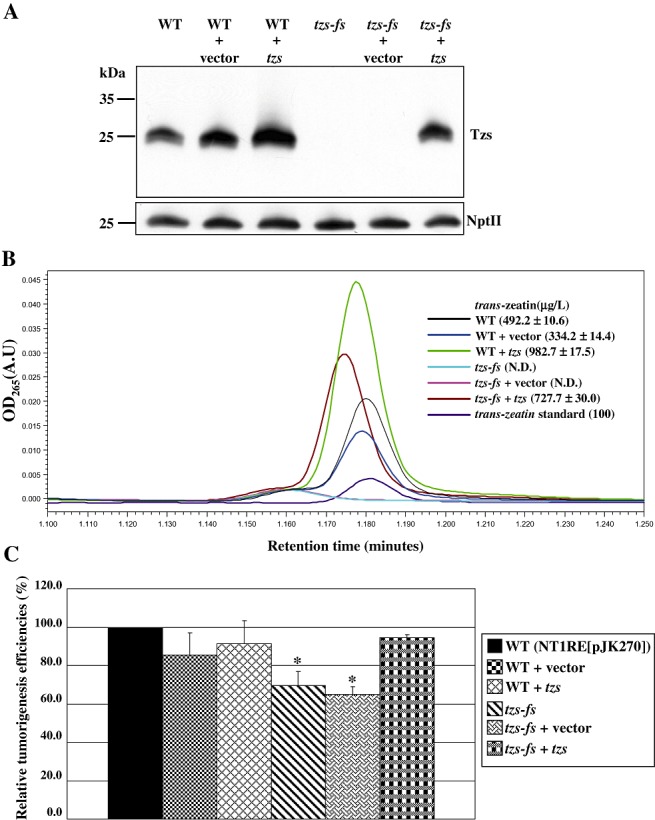
Tzs is responsible for trans‐zeatin secretion and promotes Agrobacterium tumefaciens virulence on white radish stems. (A) Immunoblot analyses of Tzs and neomycin phosphotransferase II (NptII) in the wild‐type (WT) (NT1RE[pJK270]), tzs‐fs mutant (tzs‐fs) and tzs‐complemented (tzs‐fs+tzs) strains grown in AB‐MES in the presence of 200 µm acetosyringone (AS) at 19 °C for 40 h. Equal amounts of protein were resolved by Tricine‐sodium dodecylsulphate‐polyacrylamide gel electrophoresis (SDS‐PAGE) and analysed by immunoblotting with antibodies against Tzs and NptII, which served as a loading control. The molecular weight markers are indicated on the left in kilodaltons. (B) Concentration of trans‐zeatin in the culture medium of the wild‐type, tzs‐fs mutant and tzs‐complemented strains by ultra‐performance liquid chromatography (UPLC). Culture medium from each bacterial strain grown in AB‐MES containing AS was subjected to UPLC analysis, and trans‐zeatin was eluted by methanol at a specific retention time (min, x‐axis) and detected by absorbance at 265 nm wavelength (y‐axis). The mean concentration of trans‐zeatin (µg/L) detected in each sample from three independent experiments is shown with standard deviations. N.D., not detected. The lowest concentration of trans‐zeatin detected with our UPLC system was 100 µg/L, whereas no signal could be detected when 10 µg/L of trans‐zeatin was analysed (data not shown). (C) Virulence of the wild‐type, tzs‐fs mutant and tzs‐complemented strains on white radish stems. The tumorigenesis efficiency of white radish stems infected with the wild‐type strain NT1RE(pJK270), with approximately 80%–100% of plants forming tumours in each experiment, was set at 100%, and that of the mutant is shown relative to that of the wild‐type strain. Mean values for relative tumorigenesis frequencies from at least three independent experiments are shown with standard errors. An asterisk above each mean represents a statistically significant difference between wild‐type (NTIRE[pJK270]) and tzs‐fs mutant strains based on analysis of variance (anova) and pairwise Student's t‐test. P < 0.05 for all significant differences between strain combinations.
