
Figure 7.
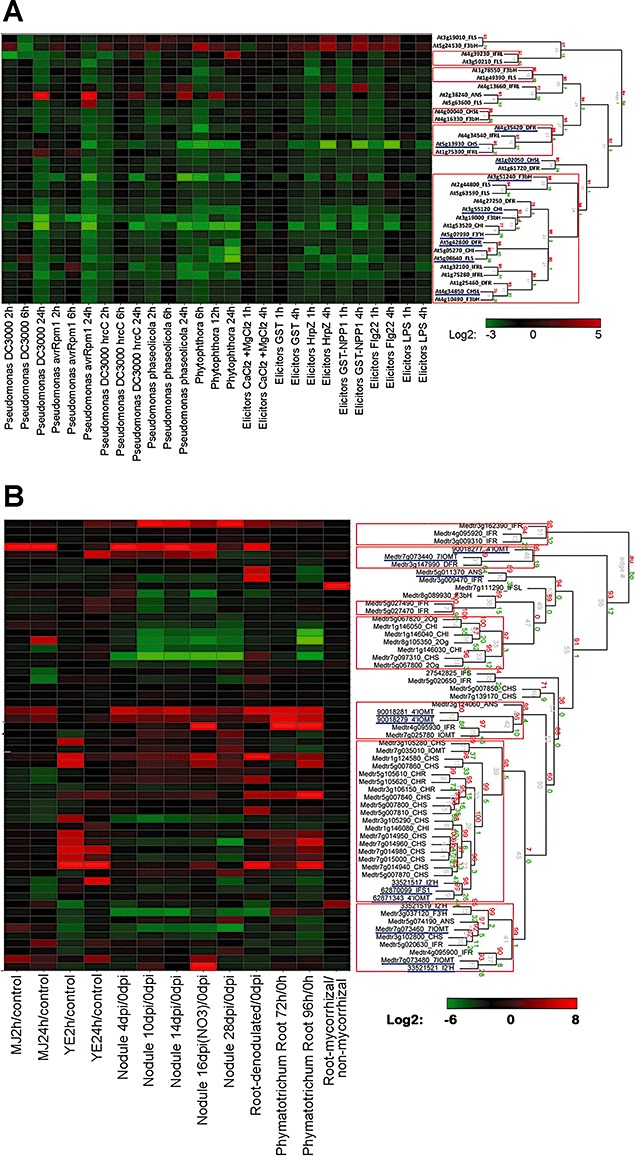
Hierarchical clustering analysis of expression patterns of flavonoid biosynthesis genes in microarray experiments involving exposure of plants to pathogens or pathogen‐derived elicitors. (A) Arabidopsis thaliana; (B) Medicago truncatula. Microarray data were obtained for A. thaliana at AtGenExpress (http://www.weigelworld.org/resources/microarray/AtGenExpress/) and for M. truncatula from MtGEAv2 (http://bioinfo.noble.org/gene‐atlas/v2/). Treatment/control fold‐change values were calculated, converted into a log2 scale (see website online) and subjected to hierarchical cluster analysis (pvclust; Suzuki and Shimodaira, 2006). Clusters with approximately unbiased (AU) P value probability of more than 95% are indicated by the red rectangles. Functionally characterized genes are underlined in blue; their National Center for Biotechnology Information (NCBI) gene accession numbers and primary literature citations are available at http://bioinfo.noble.org/manuscript‐support/mpp/.