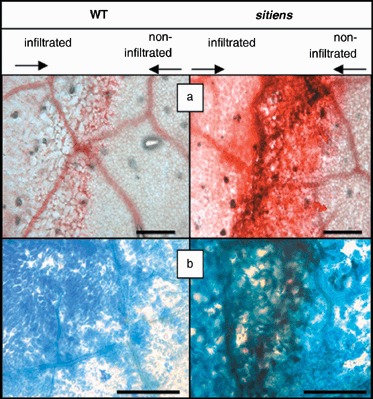
Figure 6.

Cell‐wall fortification in WT and sitiens tomato 48 h after inoculation with E. chrysanthemi. Cell‐wall fortifications were visualized with safranin‐o (red–pink) to detect incorporation of phenolics (a) and Coomassie Blue staining after SDS denaturation to detect protein cross‐linking (dark blue) (b). In both genotypes, a weak accumulation of the stains is present inside dead cells of the infiltrated zone (left), while the non‐infiltrated zone (right) remains unstained. Cell‐wall fortifications at the border of the infiltrated zone in sitiens are strongly stained. Representative borders of sitiens and WT were selected after observation of at least ten inoculation sites. The experiment was repeated with similar results. Scale bar = 200 µm.
