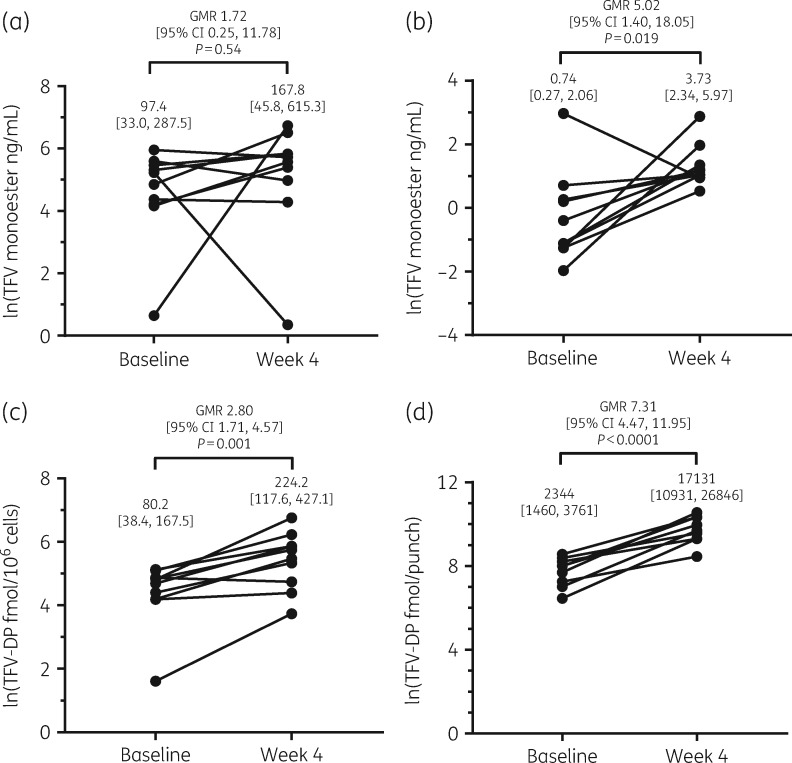
Figure 2.
Geometric mean (95% CI) plasma tenofovir monoester concentrations at baseline and after 4 weeks of ledipasvir/sofosbuvir (week 4) at (a) 1 h post-dose and (b) 4 h post-dose. Intracellular tenofovir diphosphate concentrations in (c) PBMC and (d) DBS were also significantly increased at week 4 in comparison with baseline.

