
Figure 4.
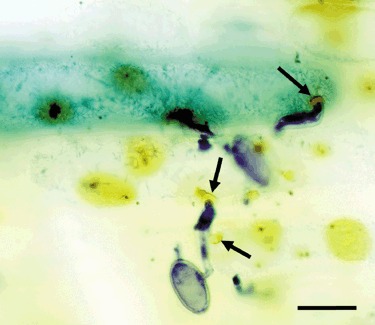
Detection of localized DAB oxidation reflecting H2O2 accumulation in transformed, GUS‐stained cells as well as in surrounding cells. Arrows point at sites of attempted penetration associated with DAB staining. Epiphytic fungal structures were stained with Coomassie blue. Scale bar, 25 µm.