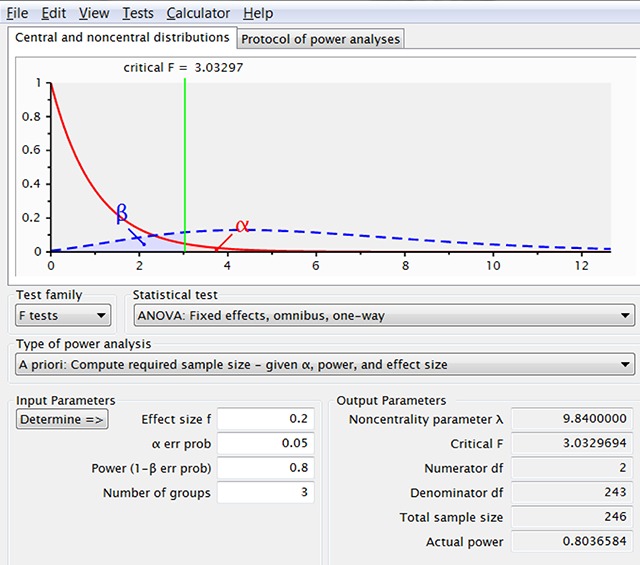
Figure 3.

Output of G*Power when we ask the required sample sizes for f = .2 and three independent groups. This number is an underestimate because the f-value for a design with d = .4 between the extreme conditions and a smaller effect size for the in-between condition is slightly lower than f = .2. In addition, this is only the power of the omnibus ANOVA test with no guarantee that the population pattern will be observed in pairwise comparisons of the sample data.
