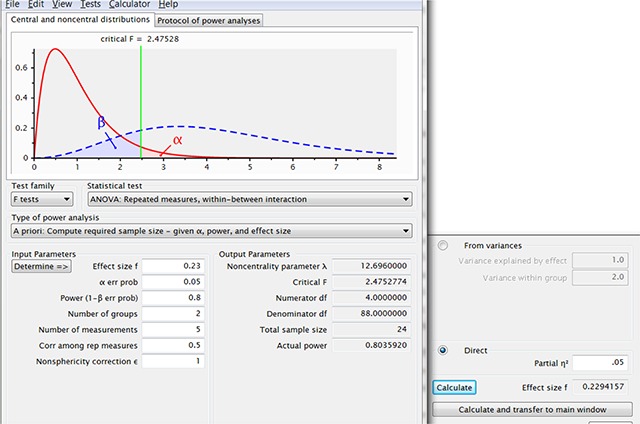
Figure 4.

Figure illustrating how you can convince yourself with G*Power that two groups of 15 participants allow you to find effect sizes of f = .23 in a split-plot design with two groups and five levels of the repeated-measures variable. When seeing this type of output, it good to keep in mind that you need 50 participants for a typical effect in a t-test with related samples. This not only sounds too good to be true, it is also too good to be true.
