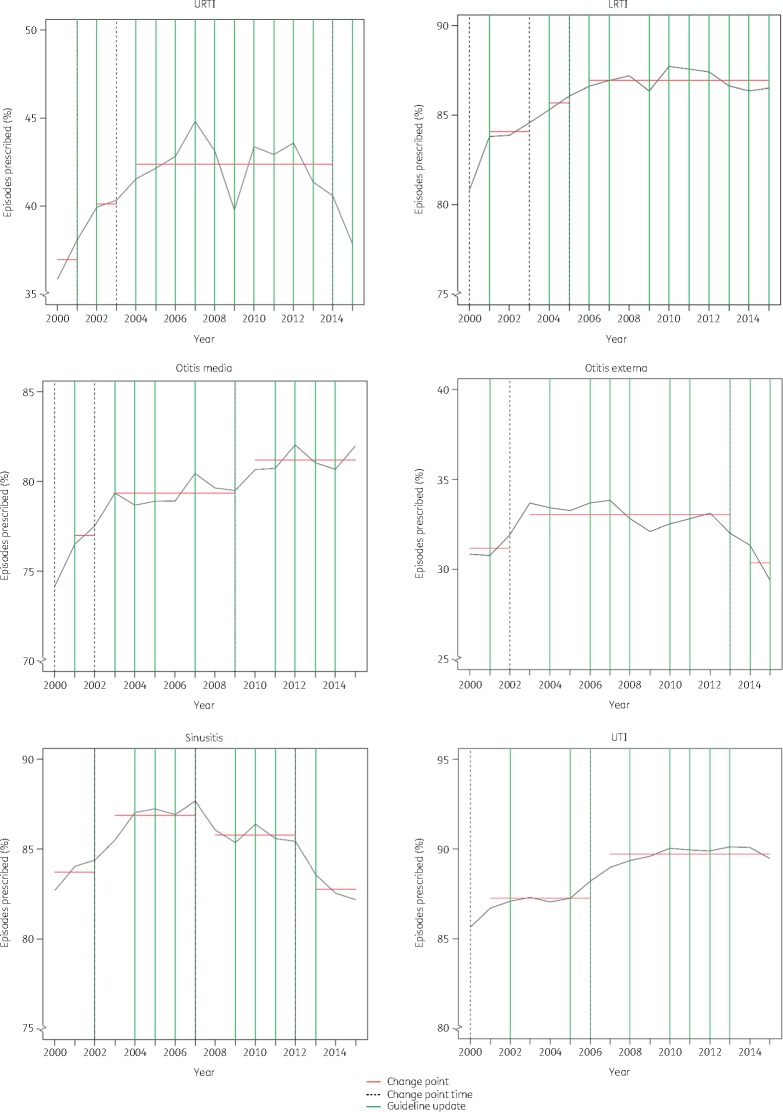
Figure 2.
CPA for prescribing of antibiotics in the UK over time. To identify any change in the mean prescribing rate for each general practice over time, the optimal number of change points was estimated (red line) for each infectious condition. The optimal change point by year is highlighted with a vertical black dotted line. These optimal changes in mean prescribing were compared with updates to national guidelines published by NICE (green lines). The results were also compared with the PHE launch of ‘Managing common infections: a guidance for primary care’ in 2010. See Table S1 (available as Supplementary data at JAC online) for the guideline-related resources. This figure appears in colour in the online version of JAC and in black and white in the print version of JAC.

