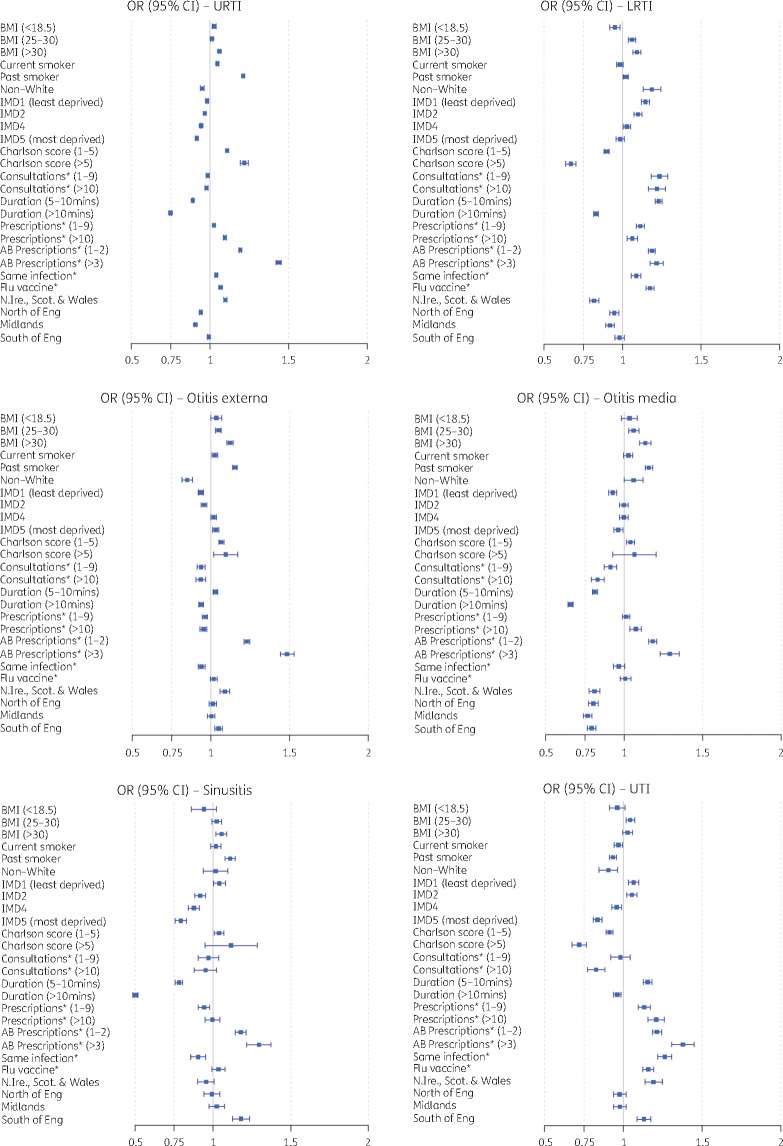
Figure 5.
Adjusted ORs (filled squares) with 95% CIs (lines) for drivers of antibiotic prescribing for each common infection. Reference categories were as follows: BMI, 20–25 mg/kg2; smoking history, non-smoker; ethnicity, white; IMD, 3; Charlson comorbidity score, 0; number of consultations*, 0; duration of consultations*, 0–5 min; number of non-antibiotic prescriptions*, 0; number of antibiotic (AB) prescriptions*, 0; same infection*, no; influenza (flu) vaccine*, no; region of practice, London. Asterisks indicate data 12 months prior to the index date. This figure appears in colour in the online version of JAC and in black and white in the print version of JAC.

