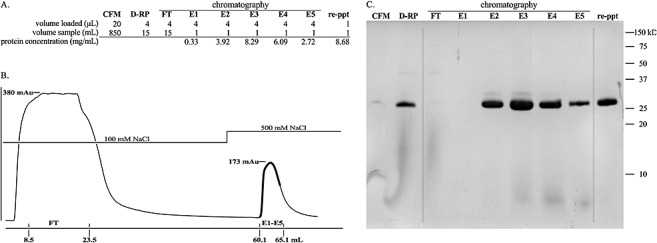
Figure 2.

Purification of rChitA. (A) The total volume of solution at each stage of purification, the volume of sample loaded in Tricine‐sodium dodecylsulphate‐polyacrylamide gel electrophoresis (Tricine‐SDS‐PAGE) and the protein concentrations of elution fractions and reprecipitated (re‐ppt) protein are listed. (B) Chromatogram of cation exchange chromatography. The y‐axis is the absorbance at 280 nm; the absorbance maxima of the flow‐through (FT) and elution (E1–E5) peaks are shown. The x‐axis is the volume of buffer (mL); the beginning and end of FT and fractions E1–E5 are shown; the dark line on the chromatogram traces the absorbance of E1–E5. (C) Tricine‐SDS‐PAGE analysis of purification. The first lane is cell‐free medium (CFM). The second lane is the dialysed, resuspended ammonium sulphate pellet (D‐RP). The third lane is the flow through from the cation exchange column (FT). The fourth to eighth lanes are the fractions that eluted after increasing the concentration of NaCl from 100 to 500 mm (E1–E5). The last lane is the purified protein, the result of combining fractions E2, E3, E4, E5 and reprecipitation of rChitA with ammonium sulphate (re‐ppt).
