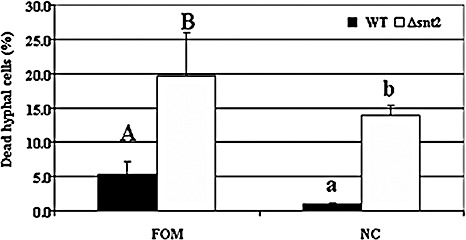
Figure 7.

snt2 disruption leads to increased cell death in Fusarium oxysporum f.sp. melonis (FOM) and Neurospora crassa (NC). Percentage of dead cells in the Δsnt2 mutants of FOM and NC, compared with their respective wild‐type (WT) isolates. Results represent the mean of three independent experiments (each with 1000 cells observed), analysed separately for each fungal species by Least Significant Difference (LSD) Tukey‐Kramer multiple comparison test (P≤ 0.05); the levels of significance are marked with different letters.
