
Figure 1.
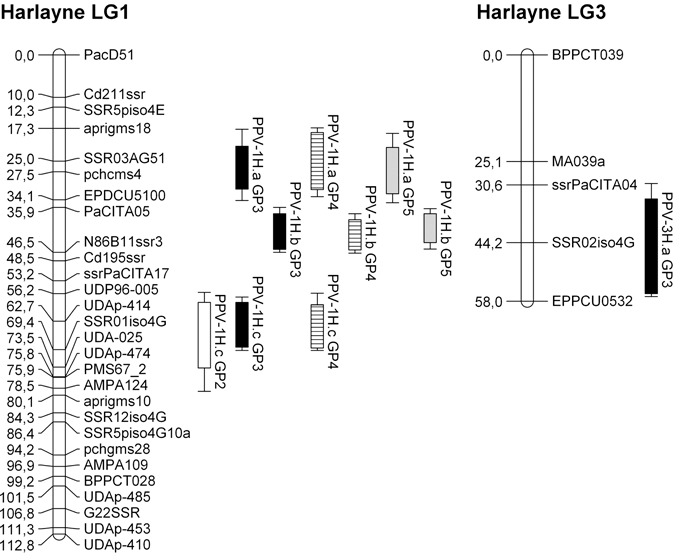
Harlayne’ genetic linkage maps of linkage groups 1 and 3 with quantitative trait loci (QTLs) mapped by composite interval mapping. Rectangles and bars represent 1 – logarithm of odds (1 – LOD) and 2 – LOD confidence intervals, respectively. GP, growth period; white, GP2; black, GP3; striped, GP4; grey, GP5.