
Figure 3.
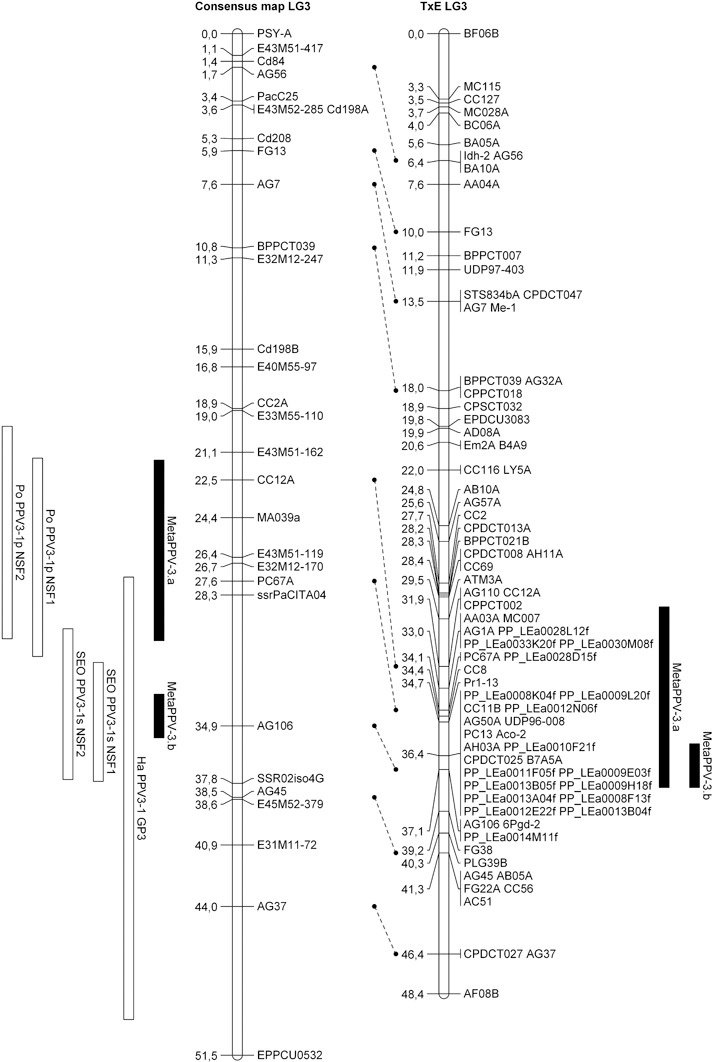
Alignment of the linkage group 3 (LG3) consensus map and LG1 Prunus reference map (TxE, ‘Texas’ × ‘Earlygold’) with quantitative trait loci (QTLs) and projected metaQTLs. Rectangles represent the 1 – logarithm of odds (1 – LOD) confidence intervals of the QTLs/metaQTLs.