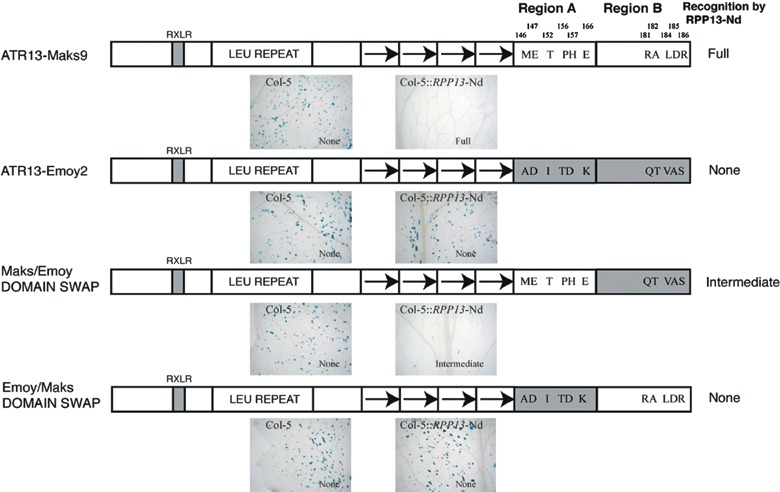
Figure 2.

ATR13 domain swap constructs and their recognition response by RPP13‐Nd in the biolistic assay. Region A and Region B are the two domains of the C‐terminal region and amino acids shown are the 11 amino acids that differ between ATR13‐Maks9 and ATR13‐Emoy2. Photographs (representative images) show the three distinct recognition response phenotypes in Col‐5 and Col‐5::RPP13‐Nd; no response results in 300–1000 blue‐stained cells per leaf, a full response results in fewer than ten per leaf and an intermediate response results in 50–150 per leaf.
