
Figure 7.
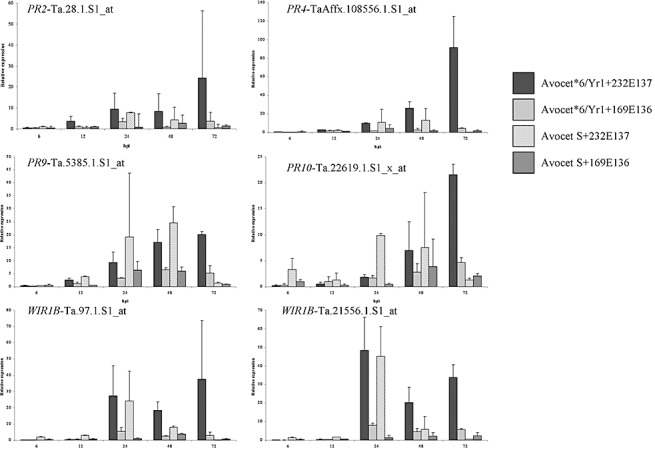
Quantitative reverse transcriptase‐polymerase chain reaction (qRT‐PCR) time‐course validation of selected array transcripts. Six differentially expressed probe sets functionally annotated to be involved in plant defence were selected for qRT‐PCR analysis. Relative transcript levels are shown for the interactions between Avocet*6/Yr1 and Avocet S with the Yr1‐avirulent isolate 232E137 and the Yr1‐virulent isolate 169E136. Transcripts analysed were PR2 (a β‐1,3‐glucanase; probe set Ta.28.1.S1_at), PR4 (a chitin‐binding protein; probe set TaAffx.108556.1.S1_at), PR9 (a peroxidase; probe set Ta.5385.1.S1_at), PR10 (a ribonuclease‐like protein; probe set Ta.22619.1.S1_x_at), and two probe sets annotated as WIR1 transcripts (Ta.97.1.S1_at and Ta21556.1.S1_at). Mean values of two independent technical replications are shown with standard deviations.