
Figure 3.
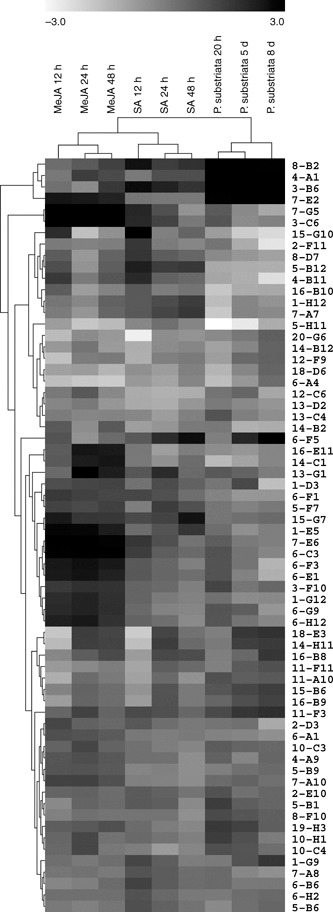
Hierarchical cluster of sequenced pearl millet cDNAs with twofold (P < 0.05) or more changes in transcript abundance in response to methyl jasmonate (MeJA), salicylic acid (SA) or Puccinia substriata treatment. Each gene is represented by a single row of boxes. Each column represents a time point following a particular treatment. Expression ratios relative to time = 0 for each treatment range from white (repressed) to black (induced) with a log2 fold‐change scale bar shown above the cluster.