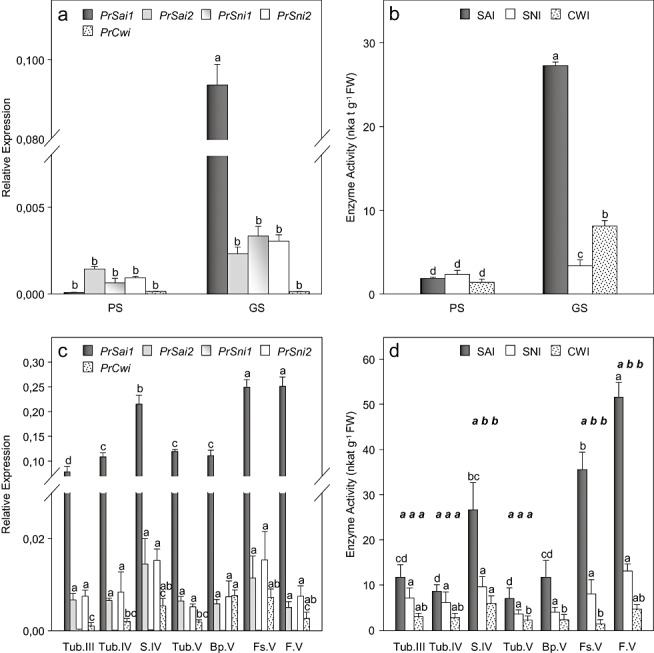
Figure 2.

Development‐related changes in the levels of invertase‐encoded gene transcripts and invertase activities in Phelipanche ramosa: (a, b) independent development following seed germination; PS, preconditioned seeds; GS, germinated seeds; (c, d) parasitic stages following attachment to tomato roots. See Fig. 5 for abbreviations of the various plant organs. (a, c) Transcript accumulation expressed relative to elongation factor 1‐α gene (EF1α) transcript levels. Data are means ± standard error (n= 3). For each gene, values with the same letter are not significantly different (anova, SNK test, P < 0.05). (b, d) Invertase activities. Data are means ± standard error (n= 6). For each isoform, activities with the same letter (plain typeface) are not significantly different (anova, SNK test, P < 0.05). For each stage of development and organ, activities with the same letter (italic and bold typeface) are not significantly different (anova, SNK test, P < 0.05).
