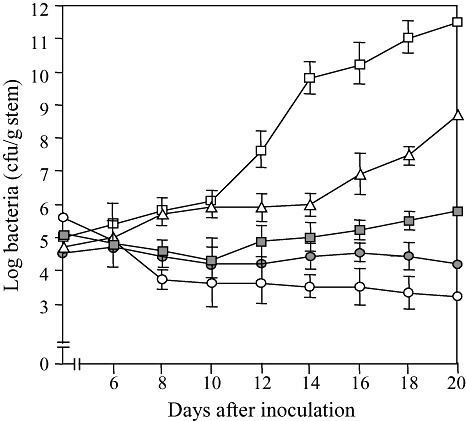
Figure 3.

Growth patterns of Ralstonia solanacearum isolates SL341 ( ), SL2029 (
 ), SL2029 rsa1::Tn3‐gusA200 (
 ), SL341(pRS13) (
 ) and SL2029 rsa1::Tn3‐gusA200(pRS13) (
 ) in potato plants. Bacterial numbers were determined every 2 days after inoculation. The data are shown as the means of five replicates. The vertical bars indicate the error ranges.
