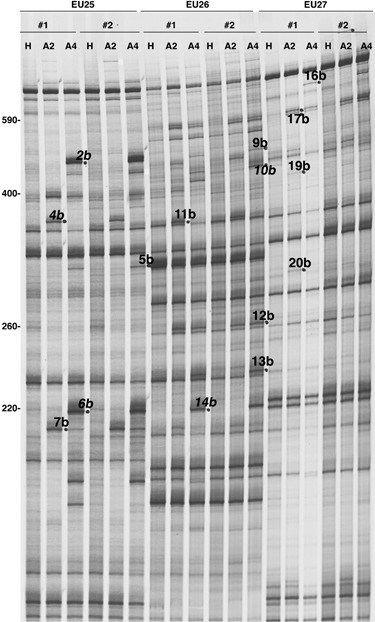
Figure 2.

Autoradiogram obtained from RFDD‐PCR analysis showing the amplification products of RNAs from Beta vulgaris healthy roots (H) used as reference, and from roots infected by a B‐type BNYVV isolate (A2) or a P‐type BNYVV isolate (A4). Amplification reactions were made in duplicates (nos. 1 and 2) using the labelled 0‐extension primer in combination with one of the three displayPROBE primers (EU25, EU26 and EU27) tested in this example. Differentially expressed bands (detected here in infected samples) are indicated by dots and FDD name reported in Table 1. Names in italic correspond to BNYVV amplified sequences. Numbers on the left refer to the size of PCR fragments (base pairs).
