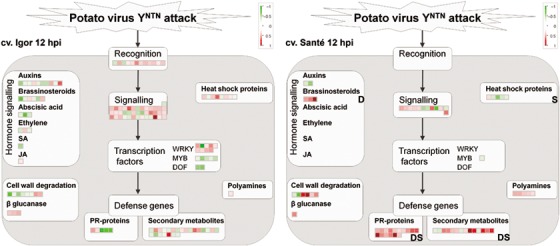
Figure 4.

Differences in gene expression between the sensitive cv. Igor and the resistant cv. Santé 12 h following potato virus YNTN (PVYNTN) inoculation. Each square represents the log2 ratio of expression of one clone in virus‐ vs. mock‐inoculated plants (red, up‐regulated; green, down‐regulated). Bold letters mark the confirmation of results by data mining (D) or subtraction library (S). Detailed information about the differentially expressed genes shown in the figure can be found in Table S1 under the corresponding MapMan bins: recognition (20.1.2: stress.biotic.receptors); signalling (30: signalling; 20.1.3: stress.biotic.signalling); WRKY (27.3.32: RNA.regulation of transcription.WRKY domain transcription factor family); MYB (27.3.25: RNA.regulation of transcription.MYB domain transcription factor family); DOF (RNA.regulation of transcription.C2C2(Zn) DOF zinc finger family); PR‐proteins (20.1.7: stress.biotic.PR‐proteins); secondary metabolites (16: secondary metabolism; 20.1.8: stress.biotic.secondary metabolites); auxins (17.2: hormone metabolism.auxin); brassinosteroids (17.3: hormone metabolism.brassinosteroid); abscisic acid (17.1: hormone metabolism.abscisic acid); ethylene (17.5: hormone metabolism.ethylene); SA (17.8: hormone metabolism.salicylic acid); JA (17.7: hormone metabolism.jasmonate); cell wall degradation (10.6: cell wall.degradation); β‐glucanase (26.4: misc.beta 1,3 glucan hydrolases); heat shock proteins (20.2.1: stress.abiotic.heat); polyamines (22: polyamine metabolism).
