
Figure 4.
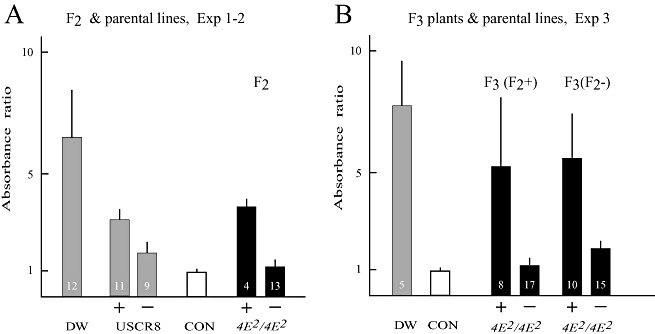
Average Bean common mosaic virus (BCMV) absorbance ratios in parental genotypes, F2 plants homozygous for PveIF4E2 (4E2/4E2) and F3 plants derived from 4E2/4E2 F2 plants. (A) 4E2/4E2 F2 individuals (dark columns) and parental USCR8 plants (USCR8, grey columns) from experiments 1 and 2 are divided into enzyme‐linked immunosorbent assay (ELISA)‐positive (+) and ELISA‐negative (–) groups and compared with parental cultivar Dubbele Witte (DW) (all‐susceptible, grey column). (B) F3 plants (dark columns) derived from ELISA‐positive (+) and ELISA‐negative (‐) 4E2/4E2 F2 (F2+ and F2–, respectively) plants were inoculated with BCMV strain NL1 and analysed by BCMV ELISA of the top leaves at 6 weeks post‐inoculation (wpi). F3 plants within each group were subdivided into ELISA positive (+) and ELISA negative (–) on the basis of the absorbance ratio. Columns show the absorbance ratios and the bars on top indicate the standard deviation within each group. The ELISA control (CON, white column) is the average of two non‐inoculated plants of USCR8. The number of plants in each group is indicated.