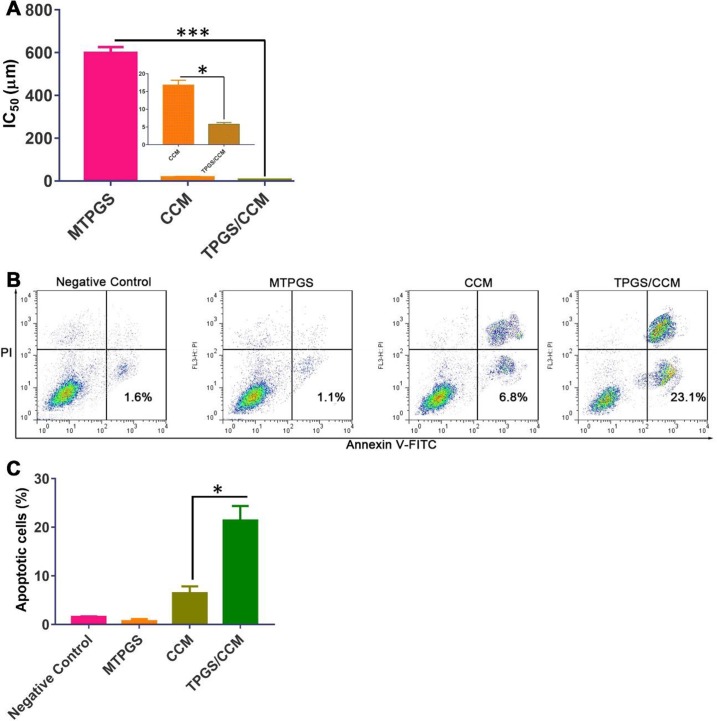
Figure 7.
HT-29 cell viability after treatment with TPGS/CCM, MTPGS, or free CCM. (A) Cytotoxicity was measured using the MTT assay. The inset in (A) shows a magnified view of the CCM and TPGS/CCM groups. (B) Flow cytometric analysis of HT-29 cells treated with different formulations. (C) Percentage of apoptotic cells in different treatment groups. *p < 0.05, ***p < 0.001.

