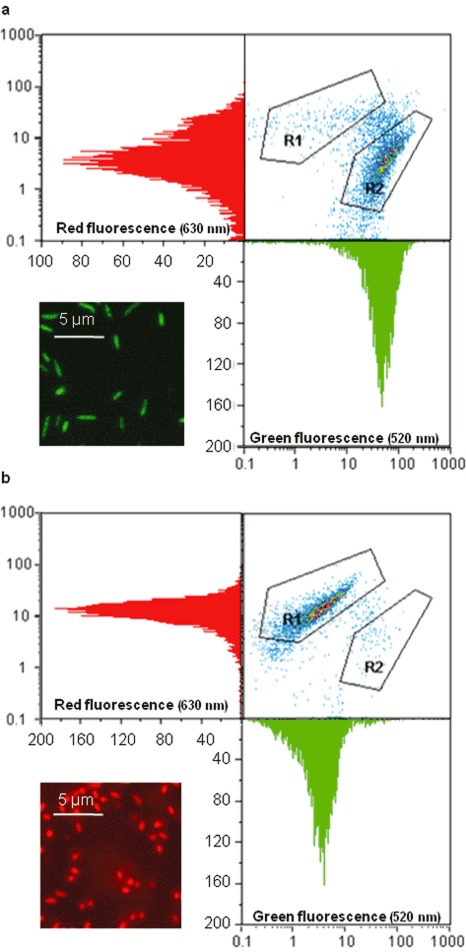
Figure 4.

Flow cytometer output and fluorescence microscope images of Syto9/PI stained Pseudomonas cichorii before and after heat treatment (60°C, 10 min). (a) Living P. cichorii have a high green fluorescence intensity and a lower red fluorescence intensity and appear in gate R2 on the 520–630 nm dot plot, a minority of the bacteria are dead and appear in gate R1; microscopic observation shows green fluorescent bacteria. (b) Heat‐killed P. cichorii have a low green fluorescence intensity and a high red fluorescence intensity and appear in gate R1 on the 520–630 nm dot plot, a few bacteria survived and are still visible in gate R2; microscopic observation shows red fluorescent bacteria.
