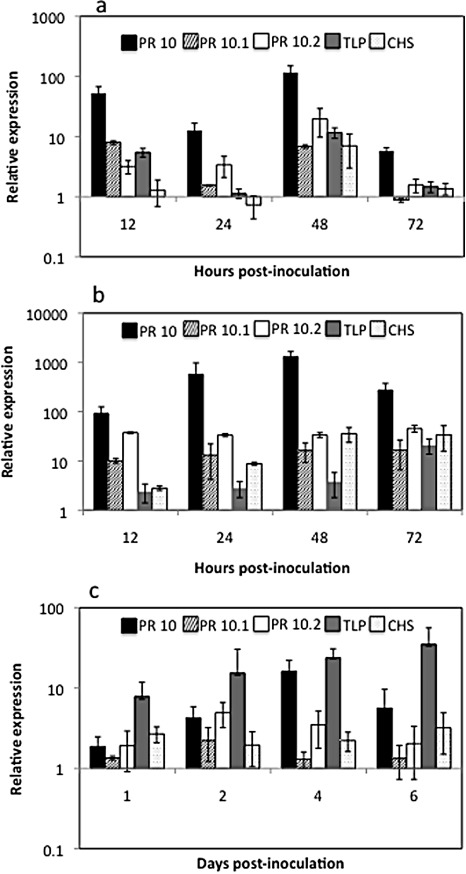
Figure 3.

Relative expression of pathogenesis response (PR)10, PR10.1, PR10.2, thaumatin‐like protein (TLP) and chalcone synthase (CHS) in Medicago truncatula R108 after pathogen inoculation by quantitative reverse transcriptase‐polymerase chain reaction (qRT‐PCR). Values are the average fold difference of inoculated plants relative to mock‐inoculated plants as determined by the ΔΔC t method. Bars indicate standard deviation (n= 3). (a) Relative gene expression in leaves inoculated with Colletotrichum trifolii race 1. (b) Relative gene expression in leaves inoculated with Erysiphe pisi. (c) Relative gene expression in roots of plants inoculated with Phytophthora medicaginis.
