
Figure 1.
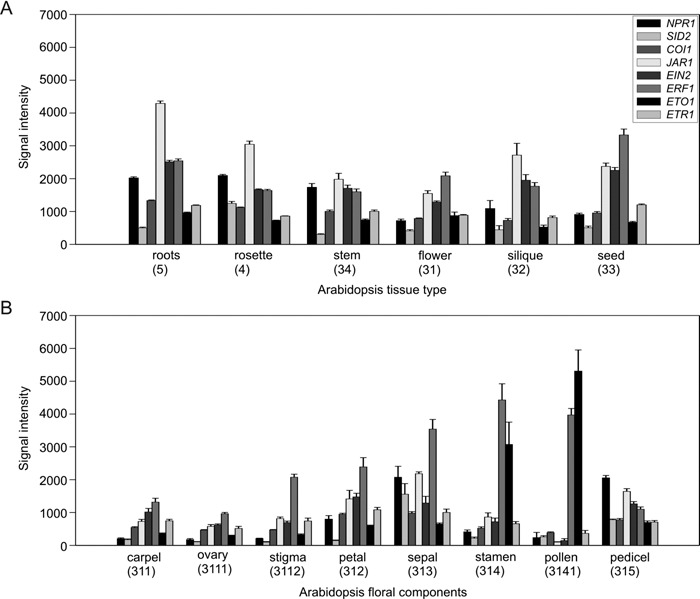
GENEVESTIGATOR analysis of the tissue‐specific expression profiles of the eight selected defence signalling genes. (A) Expression levels for individual genes for the six indicated plant tissues. (B) Expression levels of the same genes for eight specific flower tissue components. These data were extracted from the Gene Atlas Tool of the GENEVESTIGATOR microarray database (Zimmermann et al., 2004). Bars represent the mean signal intensities and error bars represent the standard error. The numbers in brackets below each tissue name refer to the GENEVESTIGATOR Arabidopsis anatomy nomenclature.