
Figure 5.
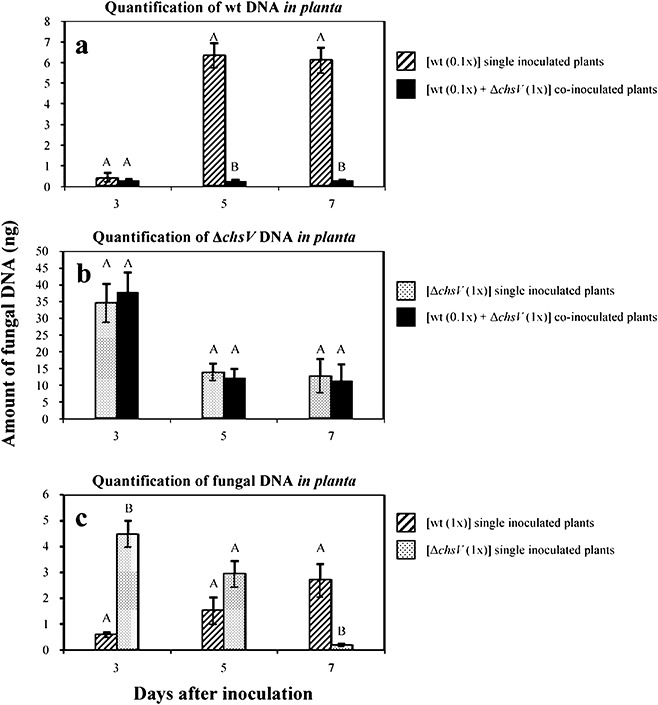
Comparative analysis of fungal biomass during single‐ or co‐inoculation experiments. (a) Quantitative real‐time polymerase chain reaction (PCR), with primer pair CHSV‐3 and CHSV‐26 specific for the wild‐type strain, on total DNA from single‐inoculated (striped bars) (using inoculation density of 5 × 10⁵ microconidia/mL) or co‐inoculated (black bars) (using the ratio 5 × 10⁵ microconidia/mL wild‐type : 5 × 10⁶ microconidia/mL ΔchsV mutant) tomato plants. (b) Quantitative real‐time PCR, with primer pair GPDA‐16 and CHSV‐6 specific for the ΔchsV mutant, on total DNA from single‐inoculated (dotted bars) (using inoculation density of 5 × 10⁶ microconidia/mL) or co‐inoculated (black bars) (using the ratio of 5 × 10⁵ microconidia/mL wild‐type : 5 × 10⁶ microconidia/mL ΔchsV mutant) tomato plants. (c) Quantitative real‐time PCR, with a primer pair specific for the Fusarium oxysporum actin1 gene, on total DNA from plants singly inoculated with the wild‐type strain (striped bars) or the ΔchsV mutant (dotted bars) using an inoculation density of 5 × 10⁶ microconidia/mL in both cases. Data represent nanograms of fungal DNA amplified from 100 ng of DNA extracted from infected stems. Each column represents the mean from three independent inoculation experiments with three replicates each. Standard error bars are indicated. Columns with the same letter within the same day are not significantly different (Duncan, P≤ 0.05).