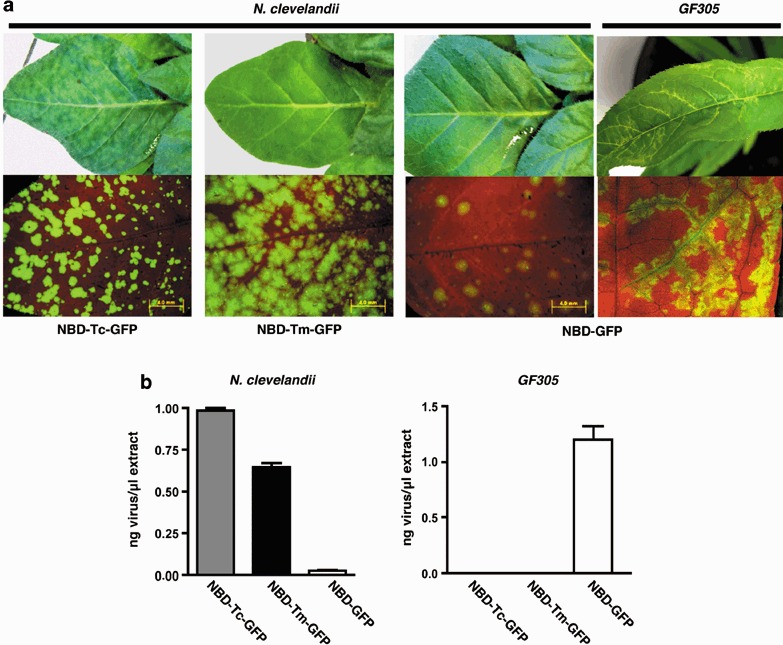
Figure 3.

Analysis of NBD‐GFP, NBD‐Tm‐GFP and NBD‐Tc‐GFP infection in N. clevelandii and GF305 peach. (a) Symptoms and GFP expression observed under visible or UV light, respectively, at 21 days post‐inoculation (dpi) for N. clevelandii and at 35 dpi for GF305 peach. (b) Virus accumulation in upper non‐inoculated infected leaves of N. clevelandii (21 dpi) and GF305 peach (35 dpi) plants. Bars represent the average values and standard deviations of four N. clevelandii and eight peach plants.
