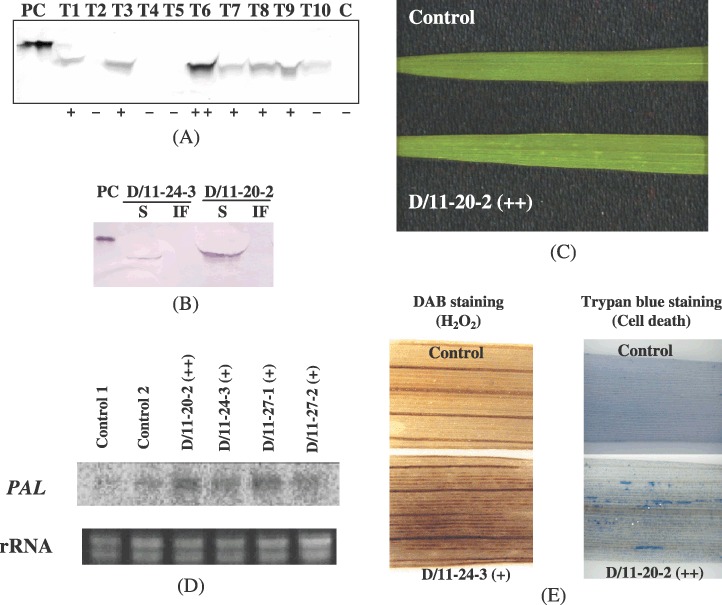
Figure 1.

Analysis of flagellin production and the immune response. (A) Detection of N1141 flagellin production in transgenic rice. Thirty micrograms of soluble proteins from the leaves of the primary transgenic plants (T) and ‘Koshihikari’ (C) were subjected to immunoblot analysis . As a reference (positive control, PC), 30 ng of histidine‐tagged N1141 flagellin was used. Results: –, not detected; +, 0.015–0.05% of total soluble leaf proteins; ++, more than 0.05% of total soluble leaf proteins. (B) Localization of flagellin production. S, total soluble leaf protein fractions; IF, intercellular fluid fractions. (C) Chlorotic spots observed on the leaves of a transgenic plant that accumulated flagellin. (D) Northern blot analysis of the expression of the PAL gene. Ten micrograms of total RNA from leaves of primary transgenic plants was used for RNA blotting. (E) Detection of H2O2 (left) and cell death (right) in transgenic rice. H2O2 was detected as brown spots among the main veins of a leaf of the transgenic plant. Cell death was detected as blue spots along the veins of the leaves of transgenic plants. In panels C, D and E, a transgenic plant harbouring pSB24 was used as a control and parentheses indicate the level of flagellin production.
