
Figure 1.
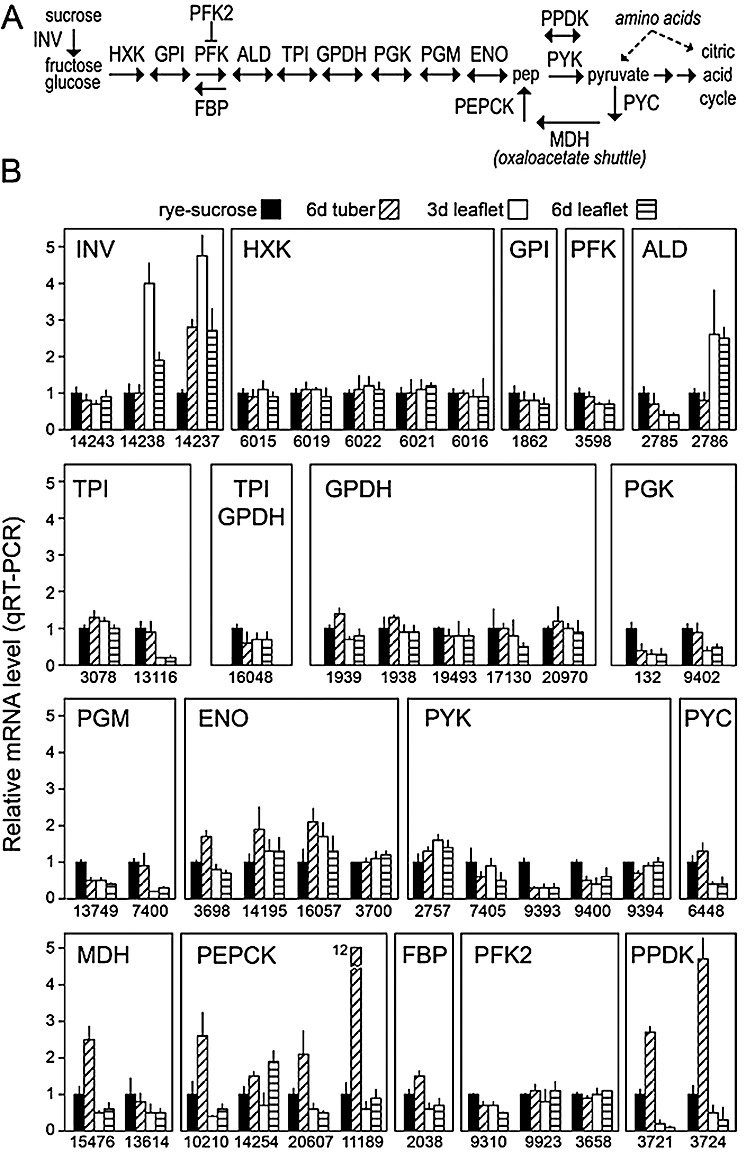
(A) Diagram of metabolic pathways illustrating the role of the enzymes involved in glycolysis and gluconeogenesis. Enzymes are shown in capital letters using the abbreviations given in Table 1, and selected compounds and other pathways are presented in lower case letters. (B) Quantitative reverse transcription‐polymerase chain reaction (qRT‐PCR) of the genes. RNA was extracted from rye–sucrose cultures, potato tubers 6 days after infection and tomato leaflets 3 and 6 days after infection, as indicated. Assays were performed in quadruplicate, including two biological replicates. mRNA levels were normalized using the Phytophthora infestans gene for ribosomal protein S3a, and are reported relative to the concentration in rye–sucrose cultures (y‐axis). Shown at the base of each figure are gene identifiers from the Broad Institute database (PITG_XXXXX).