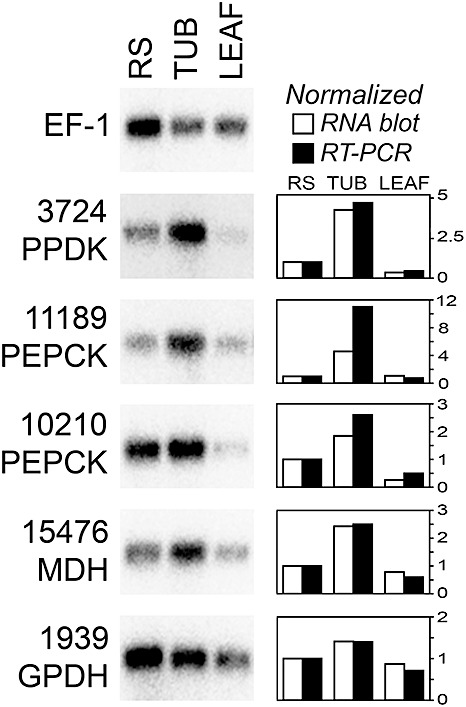
Figure 2.

RNA blot analysis of selected carbohydrate metabolism genes. RNA was from rye–sucrose cultures (RS), tubers 6 days post‐infection (TUB) or tomato leaflets 6 days post‐infection (LEAF). To help adjust for different levels of Phytophthora infestans RNA, about 10 times more RNA was loaded for the two plant samples, and then a gene for P. infestans elongation factor 1‐α was hybridized as a control. Shown at the right side of the figure are quantitative data for each gene. This was determined by phosphorimager analysis of the RNA blot, or quantitative reverse transcription‐polymerase chain reaction (qRT‐PCR) as shown in Fig. 1.
