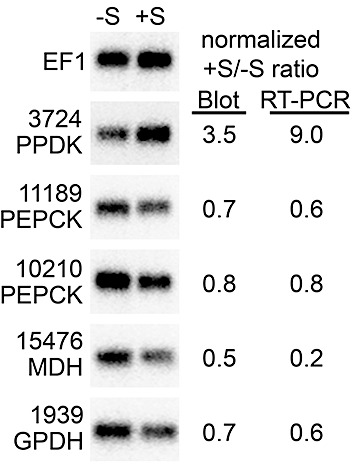
Figure 4.

RNA blot analysis of selected carbohydrate metabolism genes from sucrose‐amended and unamended broth cultures. RNA was taken from the same samples as used in Fig. 3 (–S, rye broth; +S, 2‐h sucrose pulse in rye broth). Shown on the right side of the figure are quantitative data for each gene from phosphorimager analysis of the blot, or quantitative reverse transcription‐polymerase chain reaction (qRT‐PCR) data.
