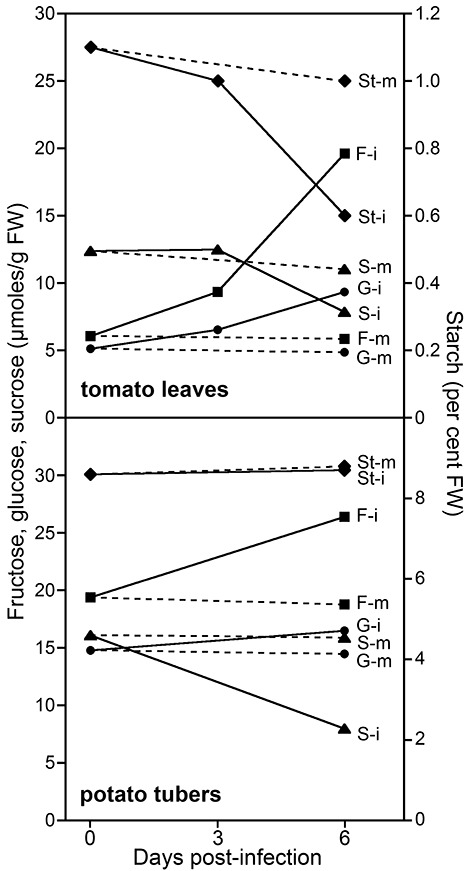
Figure 6.

Effect of infection on carbohydrate levels in leaves and tubers. Concentrations of fructose (F, squares), glucose (G, circles), sucrose (S, triangles) and starch (St, diamonds) were measured in infected (i) and mock‐infected (m) tomato leaves and tubers at the indicated times after inoculation with zoospore suspensions. Multiple infected samples were pooled and then assayed in duplicate. Error bars are omitted for clarity.
