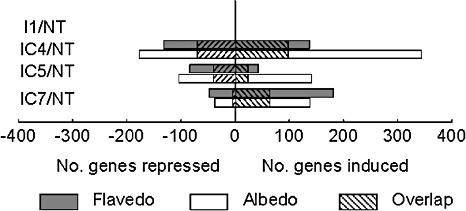
Figure 1.

Summary of differentially expressed genes [significant analysis of microarrays (SAM), P < 0.01] in the flavedo (grey bars) and albedo (white bars) of fruits infected with Penicillium digitatum during 1 day (I1) and infected and cured fruits at 4 days (IC4), 5 days (IC5) and 7 days (IC7) after the beginning of the experiment, compared with nontreated (NT) fruits. Genes differentially expressed in both tissues are represented as striped bars.
