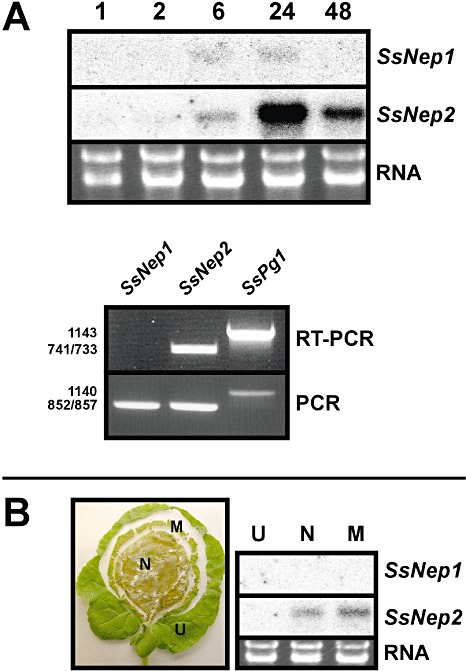
Figure 3.

Expression of Sclerotinia sclerotiorum necrosis and ethylene‐inducing peptide genes (SsNep) during infection of Brassica napus leaves. (A) Northern blot analysis showing expression in mycelia at various times (hours) after inoculation. The total RNA loaded in each lane is also shown. Lower panel shows SsNep1, SsNep2 and SsPg1 reverse transcriptase‐polymerase chain reaction (RT‐PCR) products amplified from mycelia 24 h after inoculation. Amplification of the corresponding loci using genomic DNA was conducted as a positive PCR control. (B) Division of the lesion into uninfected (U), margin (M) and necrotic (N) zones and Northern blot analysis showing expression in each zone.
