
Figure 1.
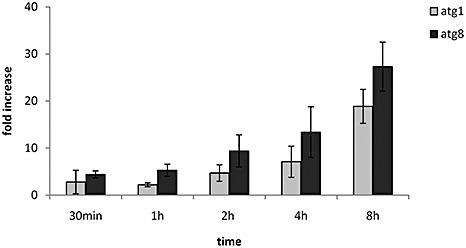
Transcript accumulation of Ustilago maydis atg8 and atg1 genes during carbon starvation. Relative levels of atg8 and atg1 transcripts were calculated by quantitative reverse transcriptase‐polymerase chain reaction (qRT‐PCR) methodology. Wild‐type RNA samples were collected at the time points indicated in the graphs. Expression levels were normalized to the control gene cpr1 (Doehlemann et al., 2009). The indicated values correspond to the means of three biological replicates; the bars represent the standard error of biological variation.