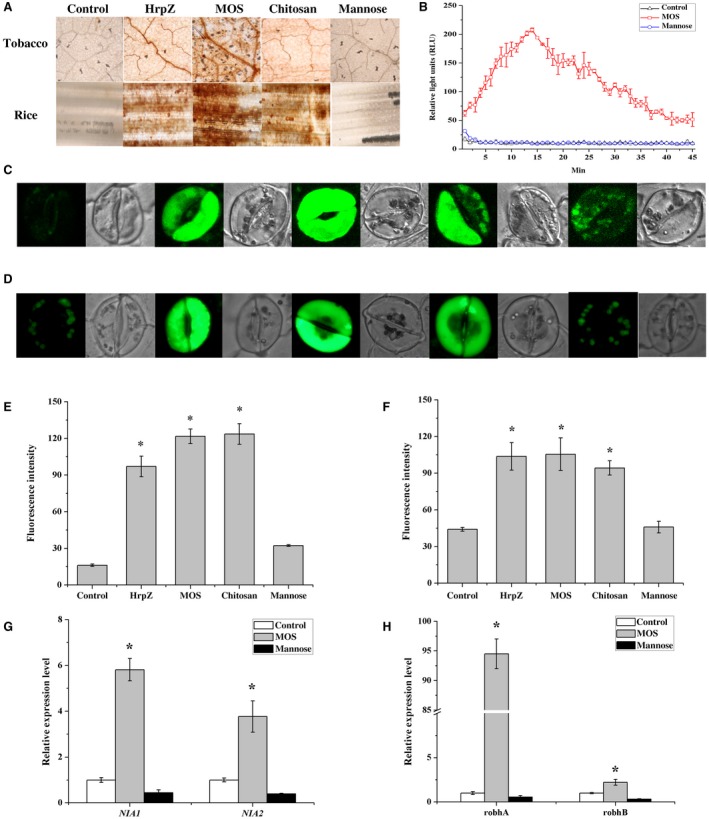
Figure 3.

MOS enhances plant H2O2 (A, B), NO (C, E, G), and ROS (D, F, H) generation. (A) Tobacco and rice leaves were injected with control buffer, HrpZ (500 μg/mL), chitosan (1000 μg/mL), mannose (13 μg/mL) or MOS (200 μg/mL) for 6 h, then cut off and soaked in DAB dye liquor for 10 h. The leaves were bleached in boiling ethanol and then visualized under a microscope. (B) H2O2 production was measured in N. benthamiana with luminol‐based assay after treatments with MOS (200 μg/mL), mannose, and control. Results are average ± SD (n = 4). NO‐sensitive dye DAF‐2DA and ROS dye DHR were loaded into cells of the epidermal peels, and fluorescence was measured after incubation with control buffer, HrpZ (500 μg/mL), chitosan (1000 μg/mL), mannose (13 μg/mL), and MOS (200 μg/mL). Representative images are shown in (C) for NO generation and (D) for ROS generation. (E, F) Quantitative analysis of NO and ROS generation using DAF‐2DA or DHR. Results are presented as the average fluorescence intensity of guard cells using ZEN software. (G, H) Transcript levels of marker genes associated with NO and ROS accumulation. Tobacco leaves were harvested after 3 h treatment with MOS, mannose, and double distilled water (ddW). NIA1, NIA2, NbrobhA, and NbrobhB were quantified by qRT‐PCR. Values represent means ± SE. The experiments were repeated three times. * indicates significant differences according to Fisher’s least‐significant difference test (P < 0.05) using SPSS software.
