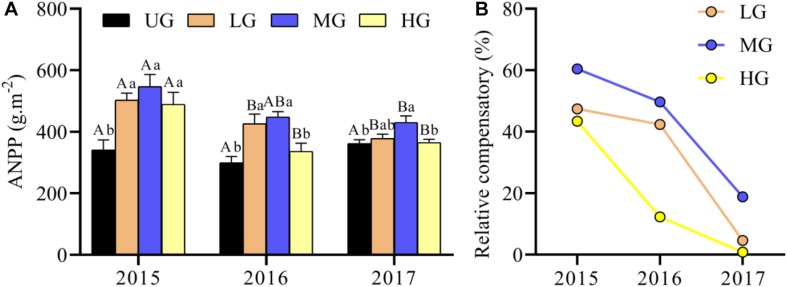
FIGURE 4.
Response of ANPP (A) and relative compensatory (B) to yak grazing intensity from 2015 to 2017. Bars indicate standard errors. Relative compensatory is calculated as the differences between each grazing treatment relative to un-grazing plots. Different lowercase letters (a,b) above the bars indicate significant difference between grazing treatments each year. Significant differences between different years within a grazing treatment are indicated by capital letters (A,B). ANPP, aboveground net primary production. UG, un-grazed; LG, light grazing; MG, moderate grazing; HG, heavy grazing.

