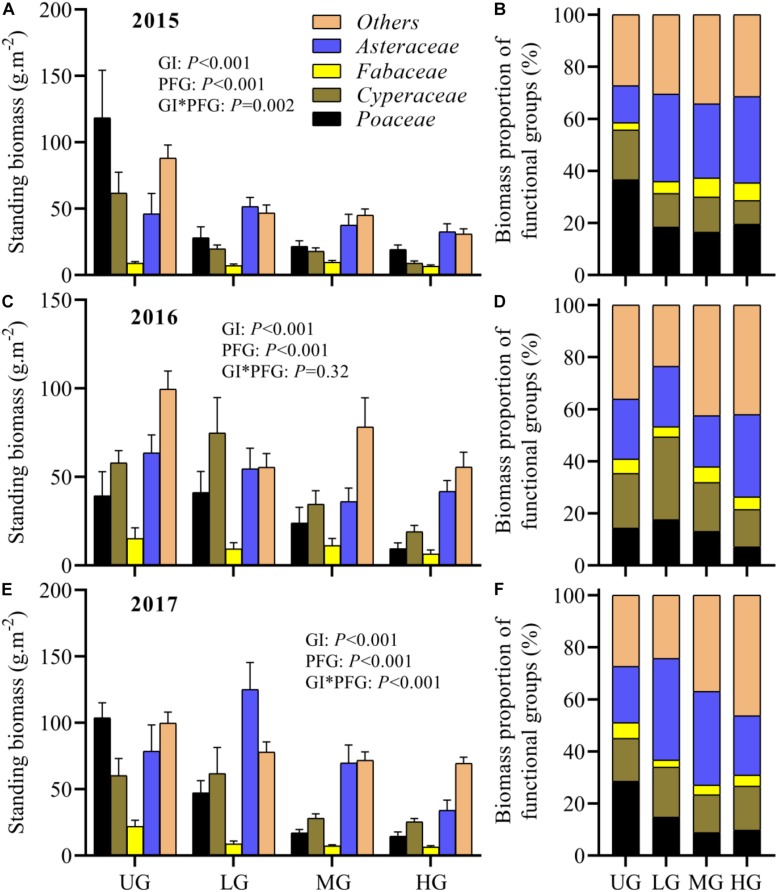
FIGURE 5.
Plant standing biomass and corresponding proportion of each functional group among different grazing treatments and years (2015: A,B; 2016: C,D; 2017: E,F). Bars indicate standard errors. GI, grazing intensity; PFG, plant functional group; UG, un-grazed; LG, light grazing; MG, moderate grazing; HG, heavy grazing.

