. 2019 May 27;10(7):1160–1164. doi: 10.1039/c9md00143c

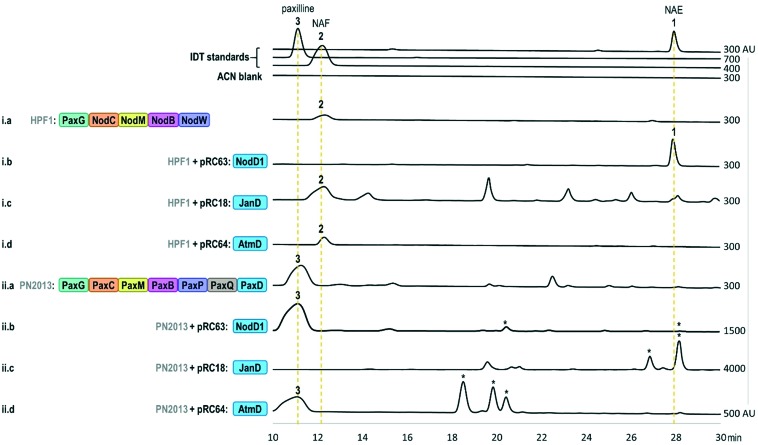
Fig. 3. HPLC analysis (230 nm) of fungal extracts. Prenylated products, as confirmed by MS fragmentation patterns, for which we do not have standards, are denoted by an asterisk (*). Note: Some traces contain peaks that have similar retention times to other prenylated IDTs, but MS results shown in Fig. S3–S5, indicate that they are not prenylated IDT compounds. Strain names (HPF1 or PN2013) are shown in grey and plasmid names (e.g. pRC63) are shown in black with the corresponding names of IDT enzymes encoded by the genes of each strain and plasmid shown within the coloured boxes. The x-axis of each trace has a minimum value of –100 arbitrary units (AU) and the maximum x-axis value is listed on the right side of the trace. Additional information regarding the strains and plasmids can be found in Tables S4, S5 and S11. .

Fig. 3