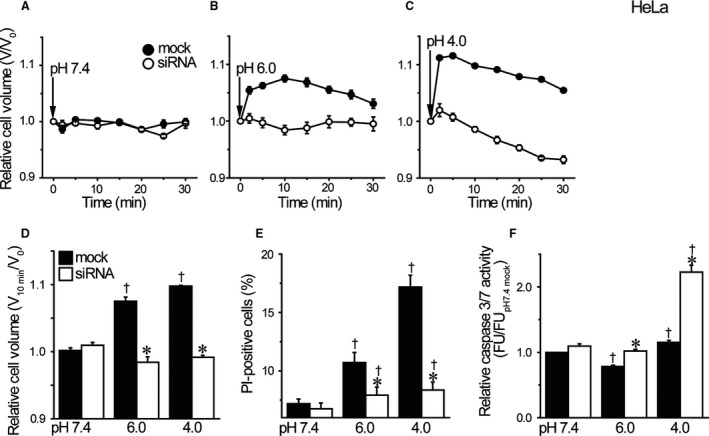
Figure 2.

Effects of TRPM7 knockdown on acid‐induced cell swelling and death in HeLa cells. (A‐C) The time course of changes in the relative mean cell volume. At time zero, pH of the bathing solution was changed. Acidic solution (pH 6.0 or 4.0) induced the necrotic volume increase (NVI) in mock‐transfected, but not TRPM7‐siRNA‐transfected, HeLa cells (n = 10). (D) Summarized data showing the relative cell volume at 10 min after application of acidic solution (pH 6.0 or 4.0). Each column represents the mean ± SEM. (E) Summarized data showing the fraction of PI‐positive cells after 1‐h exposure to pH 7.4 solution or acidic solution (pH 6.0 or 4.0) in mock‐transfected control cells (filled columns) or TRPM7‐siRNA‐transfected cells (open columns). Each column represents the mean ± SEM (n = 19). (F) The relative caspase 3/7 activity measured by a fluorometric assay after 1‐h exposure to pH 7.4 or acidic solution. Each column represents the mean ± SEM in five independent experiments. *Significantly different (P < 0.05) from the corresponding control (mock‐transfected) cells. †Significantly different (P < 0.05) from the values at pH 7.4.
