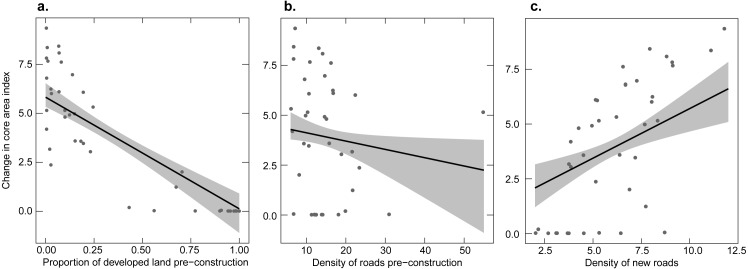
Figure 2. Relationship between the change in the core area index of undeveloped land before versus after construction and three explanatory variables.
Points show each facility; the line shows the fitted linear relationship and 95% confidence interval (gray shaded area) from the model-averaged-model holding other predictor variables at their mean value. (A) The proportion of developed land before the construction of a wind facility, (B) the density of roads before construction, (C) the density of new roads.

