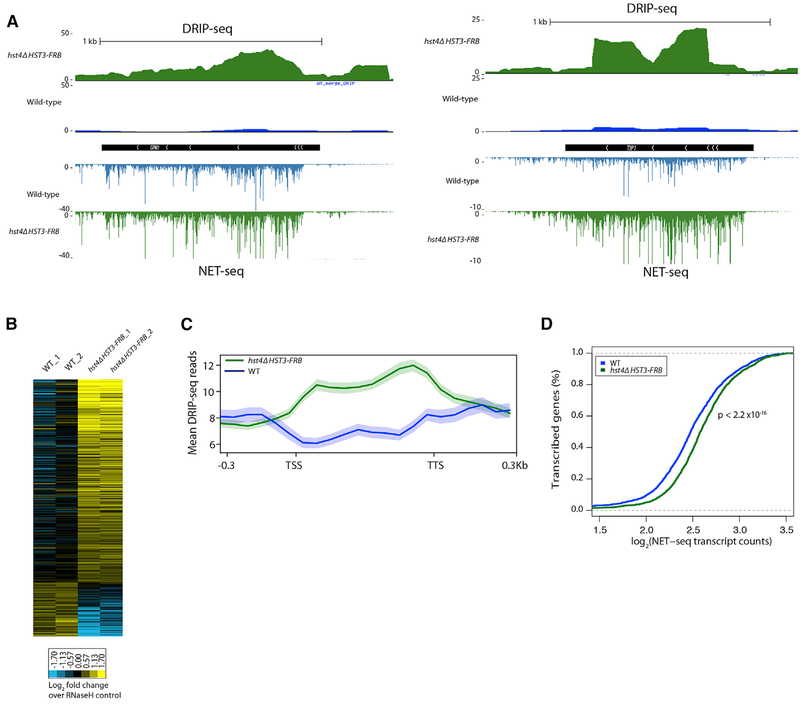
Figure 5. Increased R-Loop Abundance in the hst4Δ HST3-FRB Mutant.
(A) Representative genome browser view of normalized DRIP-seq reads in WT (blue) and hst4Δ HST3-FRB (green) cells. NET-seq reads shown below.
(B) Heatmap of DRIP-seq reads summed over ORFs normalized to RNase-H controls for two biological replicates. Shown are genes whose DRIP-seq signal increases ≥ 1.3-fold relative to RNase-H control and the FDR for WT versus hst4Δ HST3-FRB is ≤ 0.25.
(C) Metagene analysis of normalized DRIP-seq reads for genes whose DRIP-seq signal increases ≥ 1.3-fold relativeto RNase-H control. Genes scaled to 500 bp. Shaded area represents standard error.
(D) Cumulative distribution of mean NET-seq reads in WT and hst4 HST3-FRB cells for the genes in (C).
See also Figure S4.

