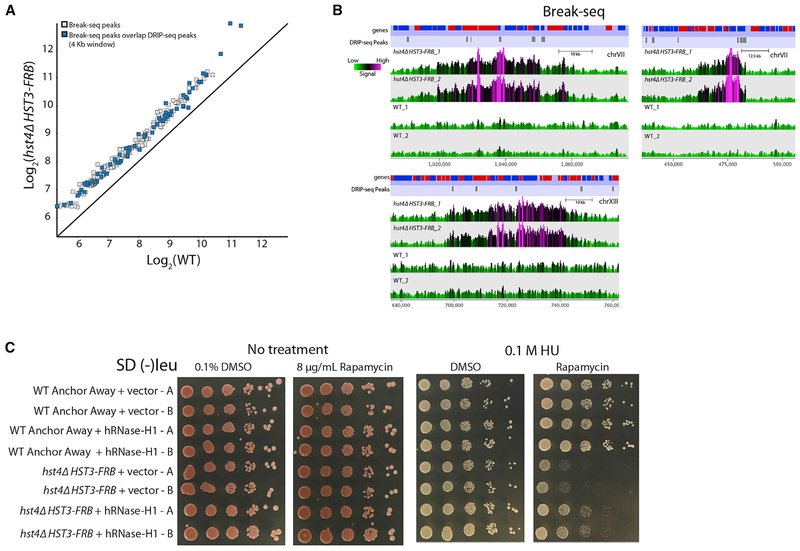
Figure 6. Role of R Loops for Increased DSBs in the hst4Δ HST3-FRB Mutant.
(A) Mean log2 MACS peak signal (p < 1 × 10⁻⁵) for two Break-seq biological replicate datasets. Blue boxes are peaks that overlap within 4 kb around genomic regions with DRIP-seq peaks in the hst4Δ HST3-FRB mutant identified by MACS.
(B) Representative genome browser views of two biological replicates of Break-seq data for hst4Δ HST3-FRB and WT using SeqMonk. Genes and DRIP-seq peaks are shown above.
(C) WT anchor away or hst4Δ HST3-FRB strains transformed with empty vector or a vector overexpressing human RNase-H1. Strains were spotted (1/10 dilutions) on 2% glucose media containing either DMSO solvent or 8 μg/mL rapamycin in the presence orabsence of 0.1 M hydroxyurea (HU) and then grown for 3 days at 30°C. Two transformants were spotted for each strain.
See also Figure S5.

