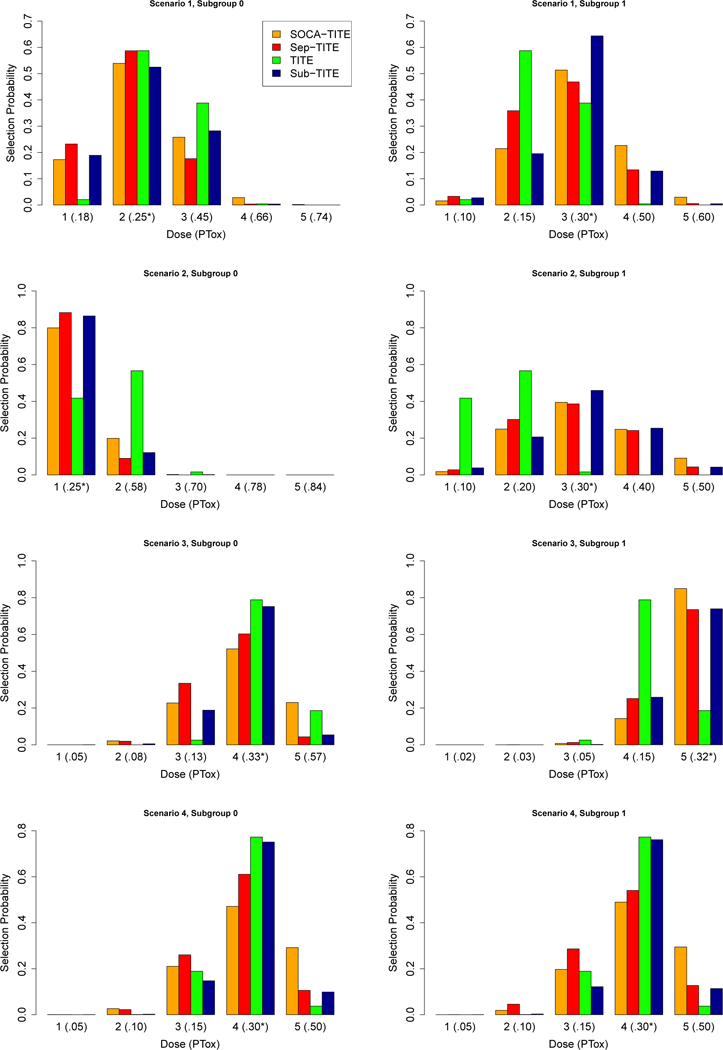
FIGURE 2.

Simulation Study: Dose selection probabilities in each of the two subgroups in scenarios 1–4. PTox denotes the true toxicity probability for each dose within each subgroup and * denotes the dose toxicity probability closest to the target of .3.
