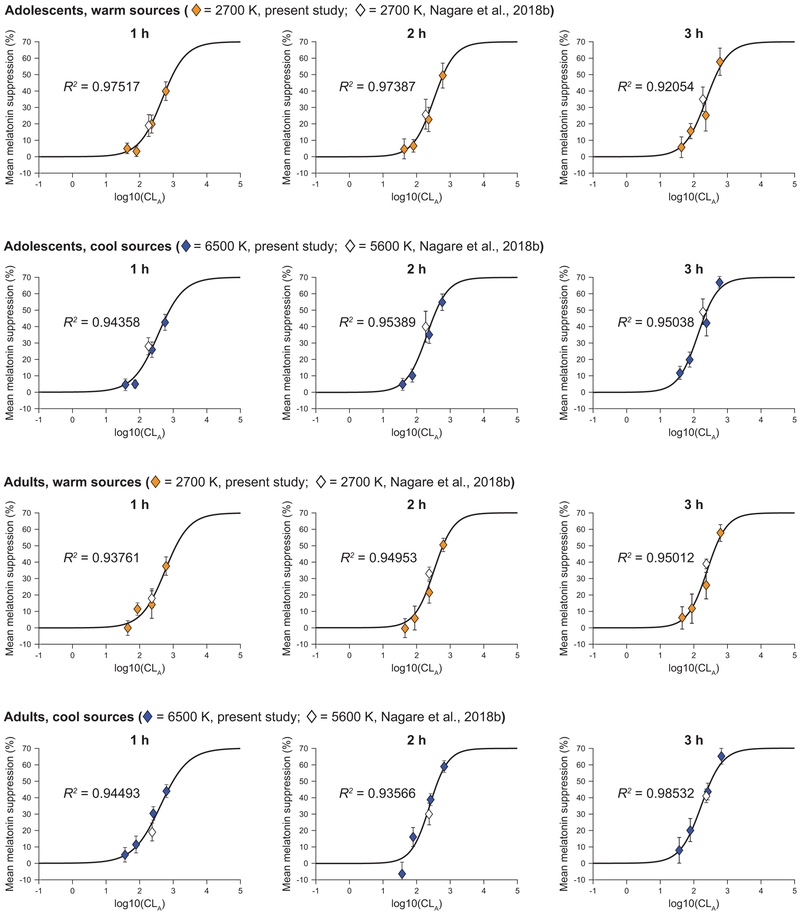
Figure 12.
Using the least squares method, a 4-parameter logistic function (Rea et al., 2012) that converts CLA to CS, was used to best-fit the melatonin suppression data at each hourly exposure duration, by age group and light source. The warm sources include the 2700 K source from the present study (solid polygons) and a similar 2700 K source from a previous white light study (hollow polygons) (Nagare et al., 2018b). The cool sources include the 6500 K source from the present study (solid polygons) and a similar 5600 K source from the same, previous white light study (hollow polygons) (Nagare et al., 2018b). The error bars represent SEM. The threshold (CS= 0.1) and half-saturation CLA levels, derived using the respective best-fit plots, were subsequently converted to photopic light levels for the respective spectra and summarized in Table 4.

