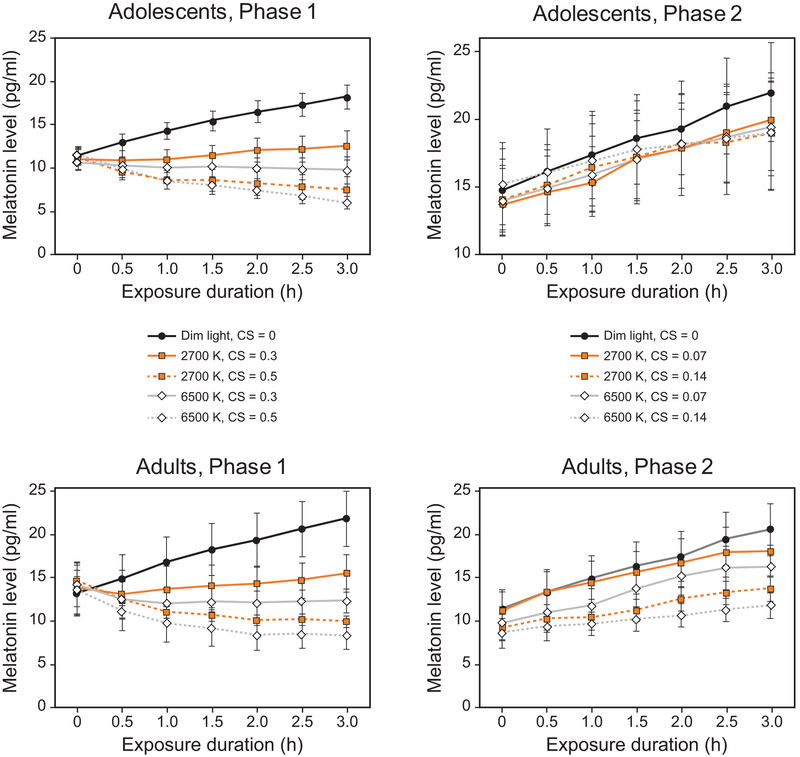
Figure 5.
Mean salivary melatonin levels for participants in the study’s 2 phases and 2 age groups at each exposure duration. The light levels for Phase 1 (16 adolescents, 16 adults) correspond to the target CS levels of 0.3 and 0.5 for the 2 spectra, and the low light levels for Phase 2 (17 adolescents, 16 adults) correspond to the target CS levels of 0.07 and 0.14 for the 2 spectra. The error bars represent SEM.

